Get Custom Dashboards for Meaningful Insights into Your Operations

Quickly grasp the tempo of your operations, on-time statuses, and travel distance monitors at a glance.

View on-time statuses via airport-style arrival and departure boards, for your team and to share with your customers.

Monitor performance using driver, expediter, fleet, and overall trip scoring. See the number of alerts, alert acknowledgements, and the impacts on KPIs.
Insights for Continuous Improvement
Understand your improvement opportunities with advanced analytics and customizable reporting.
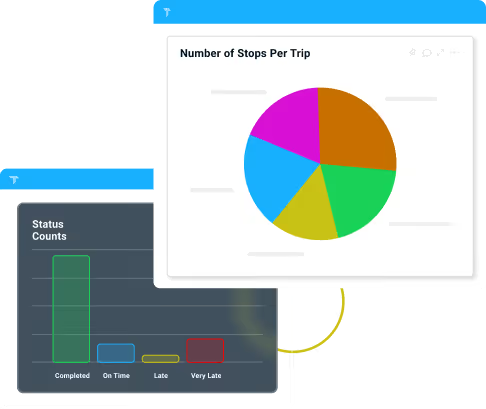
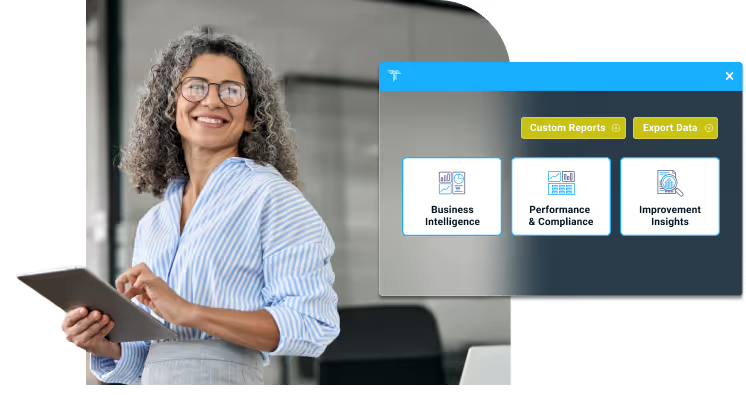
Business Intelligence
Analyze how your operations are actually performing, comparing planned data versus real-time telematics and IoT data.
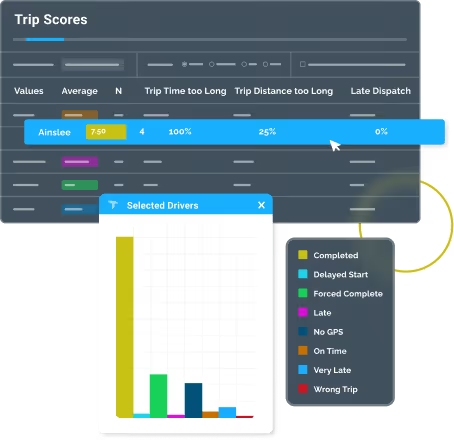
Performance and Compliance
Improve team performance, SLA compliance, and customer service with performance metrics on individual drivers, expeditors, controllers, different fleets, and customers.
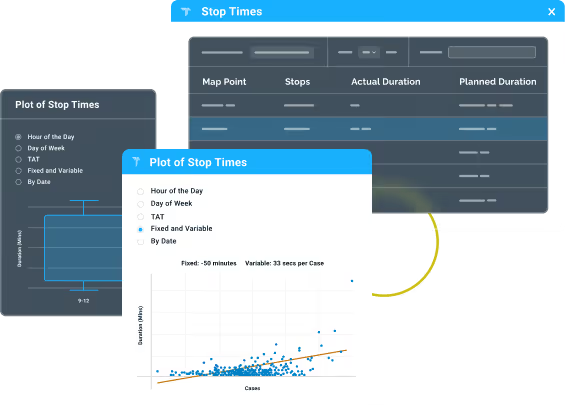
Continuous Improvement
Expand your understanding of your operational performance and elevate your decision-making with feedback loops and learned insights.

Self-Reporting
Create and export your own custom reports within Tramm.
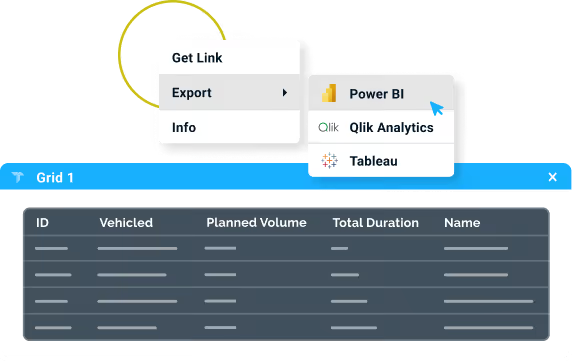
Easily Export Data via Open API
Export data into a data lake or into the tools you currently use.
Business Intelligence
Analyze how your operations are actually performing, comparing planned data versus real-time telematics and IoT data.
Performance and Compliance
Improve team performance, SLA compliance, and customer service with performance metrics on individual drivers, expeditors, controllers, different fleets, and customers.
Continuous Improvement
Expand your understanding of your operational performance and elevate your decision-making with feedback loops and learned insights.
Self-Reporting
Create and export your own custom reports within Tramm.
Easily Export Data via Open API
Export data into a data lake or into the tools you currently use.

Improved Business Performance
Measure and analyze asset performance, team performance, and even customer performance in real-time to inform your strategic business decisions and drive continuous improvement.

Better Service
Gain insights into on-time delivery performance and discover opportunities for increasing customer satisfaction. Make your customers’ job easier with live dashboards providing visibility into the current status of their deliveries.

Save Time and Money
Find actionable insights for cost-savings and save time in the process. Unlock smarter planning with advanced data analytics on planned versus actual dwell times, travel times, turnaround times, and more.
Increase Performance with Tools that Keep You in Control
Control every detail of your logistics operations without sacrificing efficiency. That’s the synergistic power of Tramm.
Automate your orders according to custom configurations and give your customers their own portal to manage orders.
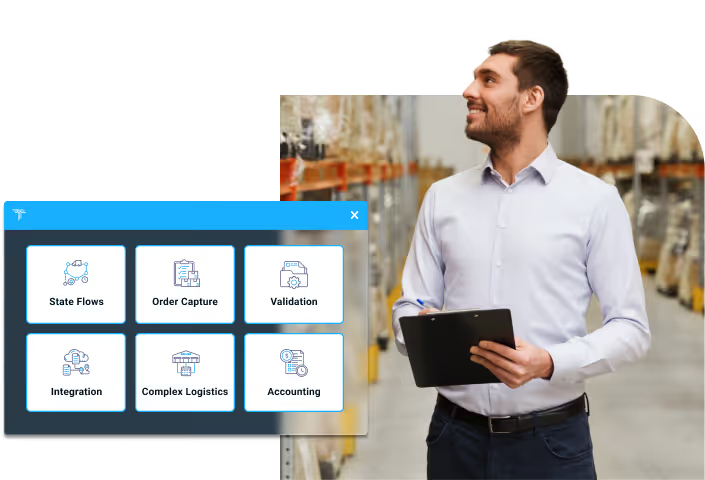
Visualize and plan optimized routes for transportation in different environments–multi-modal, cross-docks, primary and secondary distribution–while easily making real-time adjustments in a dynamic environment.

Manage the entire trip lifecycle, including internal and external transporters, tendering, tariffs, rates, documentation, and invoicing.

Stay in control with planned versus actual execution management, real-time ETAs and tracking, communication, customizable alerts, and performance analytics.
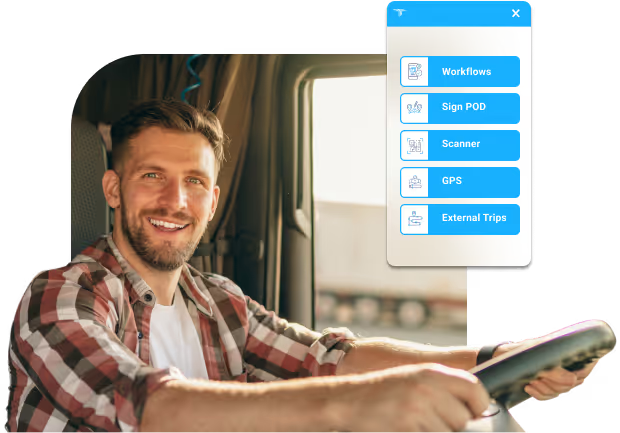
Give drivers on-the-go capabilities, from communication and ePOD submission to creating and performing custom workflows.
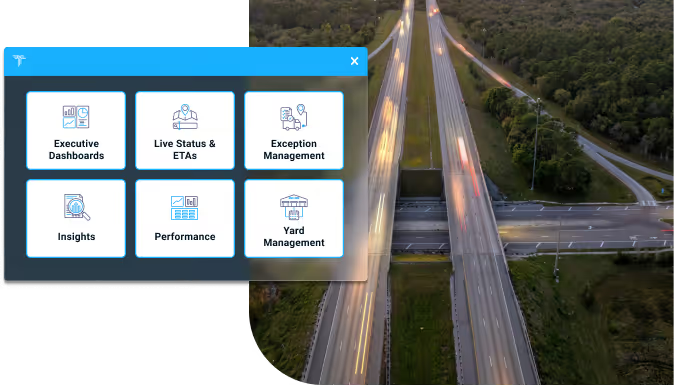
Get at-a-glance insights with comprehensive, customisable dashboards, reports, and performance analytics backed by real-time data.
Automate your orders according to custom configurations and give your customers their own portal to manage orders.
Visualize and plan optimized routes for transportation in different environments–multi-modal, cross-docks, primary and secondary distribution–while easily making real-time adjustments in a dynamic environment.
Manage the entire trip lifecycle, including internal and external transporters, tendering, tariffs, rates, documentation, and invoicing.
Stay in control with planned versus actual execution management, real-time ETAs and tracking, communication, customizable alerts, and performance analytics.
Give drivers on-the-go capabilities, from communication and ePOD submission to creating and performing custom workflows.
Get at-a-glance insights with comprehensive, customisable dashboards, reports, and performance analytics backed by real-time data.
Frequently Asked Questions
What is the Tramm Dashboard?
The Dashboard is Tramm's real-time visibility and analytics layer. It brings comprehensive, customisable dashboards, KPIs, reports and performance analytics together in one place, all backed by live operational data. At its heart is Trip View — a single screen that gives you real-time tracking, full trip history, interactive maps, performance analytics and complete control over every trip in your operation.
Who is the Dashboard built for?
The Tramm Dashboard serves every role in a transport operation. Dispatch controllers use it to monitor live trips and intervene when things go off plan; operations and fleet managers use it for post-trip review, scoring and coaching; customer service agents use it to answer delivery queries with evidence; and safety and compliance teams use it to investigate incidents and build audit trails. One screen, many jobs — without switching systems.
How is the Tramm Dashboard different from a standalone tracking tool?
Because Tramm is one unified platform on a single live entity model, the Dashboard is not a separate add-on reading stale exports. It shows the same live trips, stops, vehicles and alerts that planning, execution and the driver mobile app all work from. What you see on the map is the real operational state, updating continuously as data arrives — not a nightly snapshot.
What can I see on a live trip in the Tramm Dashboard?
Trip View shows every vehicle's current position, speed and direction on an interactive map alongside its planned route, updated continuously as GPS data arrives. You see the planned route, the actual GPS track, numbered stop markers, unplanned stops and the vehicle's last known position — with a truck icon that rotates to show direction and changes colour based on whether it is moving, briefly stopped, or stopped for more than five minutes.
How does the Tramm Dashboard show whether a trip is running on time?
Every in-progress and completed trip carries a prominent, colour-coded lateness status: on time (green), late (orange) or very late (red). For every time metric, the scheduled and actual values are shown side by side, so it is immediately clear whether a trip is ahead, on track or behind plan — down to the exact minutes ahead or behind schedule.
Can I track trip progress stop by stop in the Tramm Dashboard?
Yes. Every planned stop is tracked individually with scheduled and actual arrival and departure times, planned versus actual dwell duration, on-time status and delivery line items. A current-stop panel shows where the vehicle is right now — the stop name, arrival time, time already spent on site and a preview of the next stop — giving dispatch an instant pulse check. Clicking a stop centres the map on it.
What map layers and views does the Tramm Dashboard offer?
The map supports toggleable layers including the planned route, actual GPS track, mobile-app and manually entered paths, time markers along the track, the stop-matching tolerance window, live or historical traffic, and satellite imagery. Navigation shortcuts let you zoom to fit the whole route or jump straight to the latest GPS position for live tracking. If a vehicle was swapped mid-trip, both the original and replacement GPS tracks are shown with a marker at the handover point.
What analytics does the Dashboard provide?
Trip View includes four synchronised, zoomable charts: a trip timeline (Gantt) comparing planned schedule against actual execution, speed over time with a threshold line marking overspeeding, cumulative distance progression showing planned versus actual, and off-route distance showing how far the vehicle strayed from its planned corridor. Selecting a time range on any chart zooms all of them to the same window, so you can correlate a speed spike with the vehicle's exact position and stop.
How does the Tramm Dashboard score trips?
Every completed trip receives an objective score from 0 to 100. The score starts at 100 and deducts points for criteria such as excess trip time, excess distance, late dispatch, out-of-sequence stops, late stops, off-route driving, skipped stops, unplanned stops and return visits. Each criterion has a configurable weight, so you can emphasise what matters most to your operation — for example on-time delivery or route compliance — giving a consistent, fair basis for driver coaching.
What reports can I generate from the Tramm Dashboard?
Beyond the business-intelligence and compliance dashboards, you can generate a customer-ready trip sheet or a configurable debrief report with a single click, for any in-progress or completed trip. You choose which sections to include — trip details, stop summary, route map, alerts, GPS events and performance charts — so a customer report might show the map and stop times while an internal coaching report includes alerts and speed charts.
Are Tramm dashboards customisable?
Yes. Tramm provides comprehensive, customisable dashboards and reports so you can surface the KPIs that matter to your business, backed by real-time data. Reporting supports business intelligence, performance and compliance tracking, and continuous-improvement targets — giving managers at-a-glance insight and the detail to act on it.
How does the Tramm Dashboard handle exceptions and alerts?
Alerts triggered during a trip — overspeed, off-route, late, unplanned stop and more — appear instantly in context within Trip View, with the unacknowledged count shown prominently. Each alert with a GPS location is also pinned on the map, so you can see exactly where on the route it was triggered. You can review, acknowledge, record a reason and add a comment without ever leaving the trip.
Is there an audit trail for alerts in the Tramm Dashboard?
Yes. Every acknowledgement is permanently recorded — who acknowledged it, when, the reason chosen and any comments — and is included in the Alerts History report for compliance and incident review. If notifications were sent by WhatsApp, email or SMS, the message history is shown too, confirming the right people were notified at the right time.
What actions can I take directly from the Dashboard?
Authorised users can act on a trip without switching screens: force-complete a trip, swap the vehicle mid-trip, send trip or stop details to the driver via WhatsApp, request a live location, add a logged comment, or flag the trip for re-analysis. Access is permission-controlled — standard users view trip data, while administrators can force-complete, swap vehicles or re-analyse — and every action is recorded with the user and time.
What makes the Tramm Dashboard's data real-time?
Tramm runs on a single live entity model with real-time state cascades, so a change anywhere in the operation — a new GPS point, a completed stop, an acknowledged alert — propagates immediately to the Dashboard. Trip statuses update automatically as trips progress, and the map and KPIs reflect the current state rather than a periodic refresh.
Is the Dashboard a single source of truth?
Yes. The Trip Details panel is the single source of truth for every metric on a trip, drawing from the same unified platform data used across planning, execution and mobile. Because there is one live entity model rather than disconnected systems, everyone — dispatch, management, customer service and compliance — works from the same numbers at the same moment.
How does the Dashboard connect to the rest of Tramm?
Live GPS and trip data flow into Trip View, which feeds analytics and scoring, and connects out to alerts, driver allocation and vehicle swap, WhatsApp driver messaging, yard management call-offs, and debrief reporting. The Dashboard is one module of a unified platform rather than a bolted-on tool.
What business outcomes does the Dashboard deliver?
Teams spot delays and off-route driving early enough to intervene, resolve exceptions in context with a full audit trail, and answer customer queries with map-and-timestamp evidence. Objective trip scoring drives fair driver coaching and continuous improvement, while customisable KPIs and reports give managers the visibility to raise on-time performance, route compliance and asset utilisation across the fleet.
Can I use the Tramm Dashboard to prove delivery and resolve disputes?
Yes. Trip View and its reports provide a complete record of what happened — exactly where the vehicle was, when it arrived and departed each stop, dwell times, line items and any alerts. Customer service can confirm delivery times, show the route map as proof and generate a professional trip sheet, turning disputes into quick, evidence-based conversations.
How do I see the Dashboard in action?
The best way to appreciate real-time Trip View, KPIs and analytics is a live walkthrough against a scenario like yours. To arrange a demo or ask questions, contact the Tramm team at info@tramm.global and the team will set up a session tailored to your operation.